Military Strength: 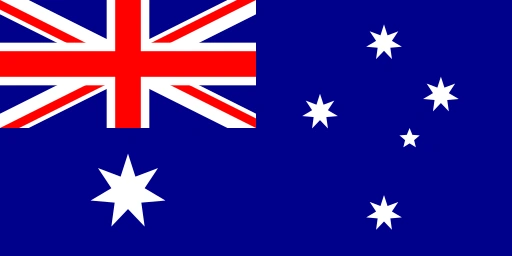 Australia vs
 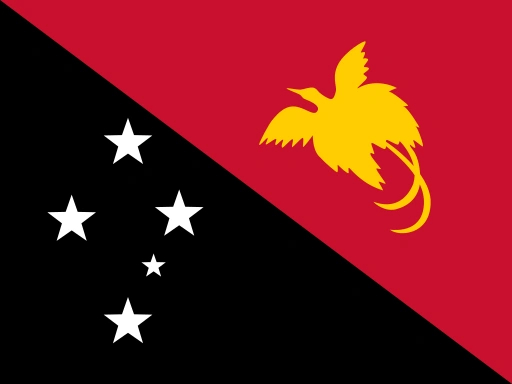 Papua New Guinea
Australia (ranked #28 globally) holds a stronger overall military position than Papua New Guinea (#151) on the ATLAS Index. Australia fields 60,000 active troops — 15:1 Papua New Guinea's 4,000, backed by 33,270 reserves. Australia's $35B defense budget is 368:1 that of Papua New Guinea ($0.10B).
ATLAS (Aggregate Total of Land, Air and Sea strength) Index face-off Full ranking →
AustraliaWorld #28
38.8
ATLAS Index / 100
Australia leads on 5 of 6 pillars
Papua New GuineaWorld #151
6.0
Australia
Papua New Guinea
Pillar scores 0–100 (weight under each label) over a headline figure from that domain · each conventional pillar read after its branch's availability proxy · Methodology
Key figures
| Australia | Papua New Guinea | Ratio | |
|---|---|---|---|
| Defense budget | $35B | $95M | 🇦🇺 368× |
| – share of GDP | 2.0% | 0.3% | 🇦🇺 6.7× |
| Active personnel | 60,000 | 4,000 | 🇦🇺 15× |
| Combat aircraft | 96 | 0 | 🇦🇺 |
| Warships | 44 | 0 | 🇦🇺 |
| – submarines | 6 | 0 | 🇦🇺 |
| Main battle tanks | 75 | 0 | 🇦🇺 |
| Nuclear warheads | 0 | 0 | — |
Show full breakdown · 11 more rowsHide the 11 extra rows
| Reserve troops | 33,270 | 0 | 🇦🇺 |
| Paramilitary forces | 0 | 0 | — |
| Military aircraft (all types) | 382 | 3 | 🇦🇺 127× |
| – helicopters | 95 | 0 | 🇦🇺 |
| Budget share of govt spending | — | — | — |
| Budget per capita | $1,292 | $9 | 🇦🇺 143× |
| Population | 27.2M | 10.6M | 🇦🇺 2.6× |
| GDP | $1.8T | $32B | 🇦🇺 55× |
| GDP per capita | $64,604 | $3,007 | 🇦🇺 21× |
| Land area | 7,633,565 km² | 452,860 km² | 🇦🇺 17× |
| Coastline | 25,760 km | 5,152 km | 🇦🇺 5.0× |
Backbone systems most numerous in service
Defense budget history Australia ×1.3 · Papua New Guinea ×1.0 since 2020
Military personnel history
Explore this matchup
Go deeper · same matchup, other lenses
Change opponent
Related comparisons & rankings
Frequently Asked Questions
Who has more military personnel, Australia or Papua New Guinea?
Australia has approximately 60,000 active military personnel compared to Papua New Guinea's 4,000, giving Australia a 15:1 numerical advantage.
Which country has more combat aircraft, Australia or Papua New Guinea?
Australia operates 96 combat aircraft compared to Papua New Guinea's 0. This includes fighters, strike aircraft, and multirole combat jets.
Who has the larger navy, Australia or Papua New Guinea?
Australia has a larger navy with 44 vessels compared to Papua New Guinea's 0 ships. Australia operates 6 submarines while Papua New Guinea has 0.
Which country spends more on defense, Australia or Papua New Guinea?
Australia has a larger defense budget at $35.1 billion (368:1 more) compared to Papua New Guinea's $95 million annually.
Do Australia and Papua New Guinea have nuclear weapons?
Neither Australia nor Papua New Guinea currently possesses nuclear weapons.
How do the tank forces of Australia and Papua New Guinea compare?
Australia operates 75 main battle tanks compared to Papua New Guinea's 0. Tank numbers reflect both active inventory and reserves.