Defense Spending (% of GDP) (Europe)
Overview
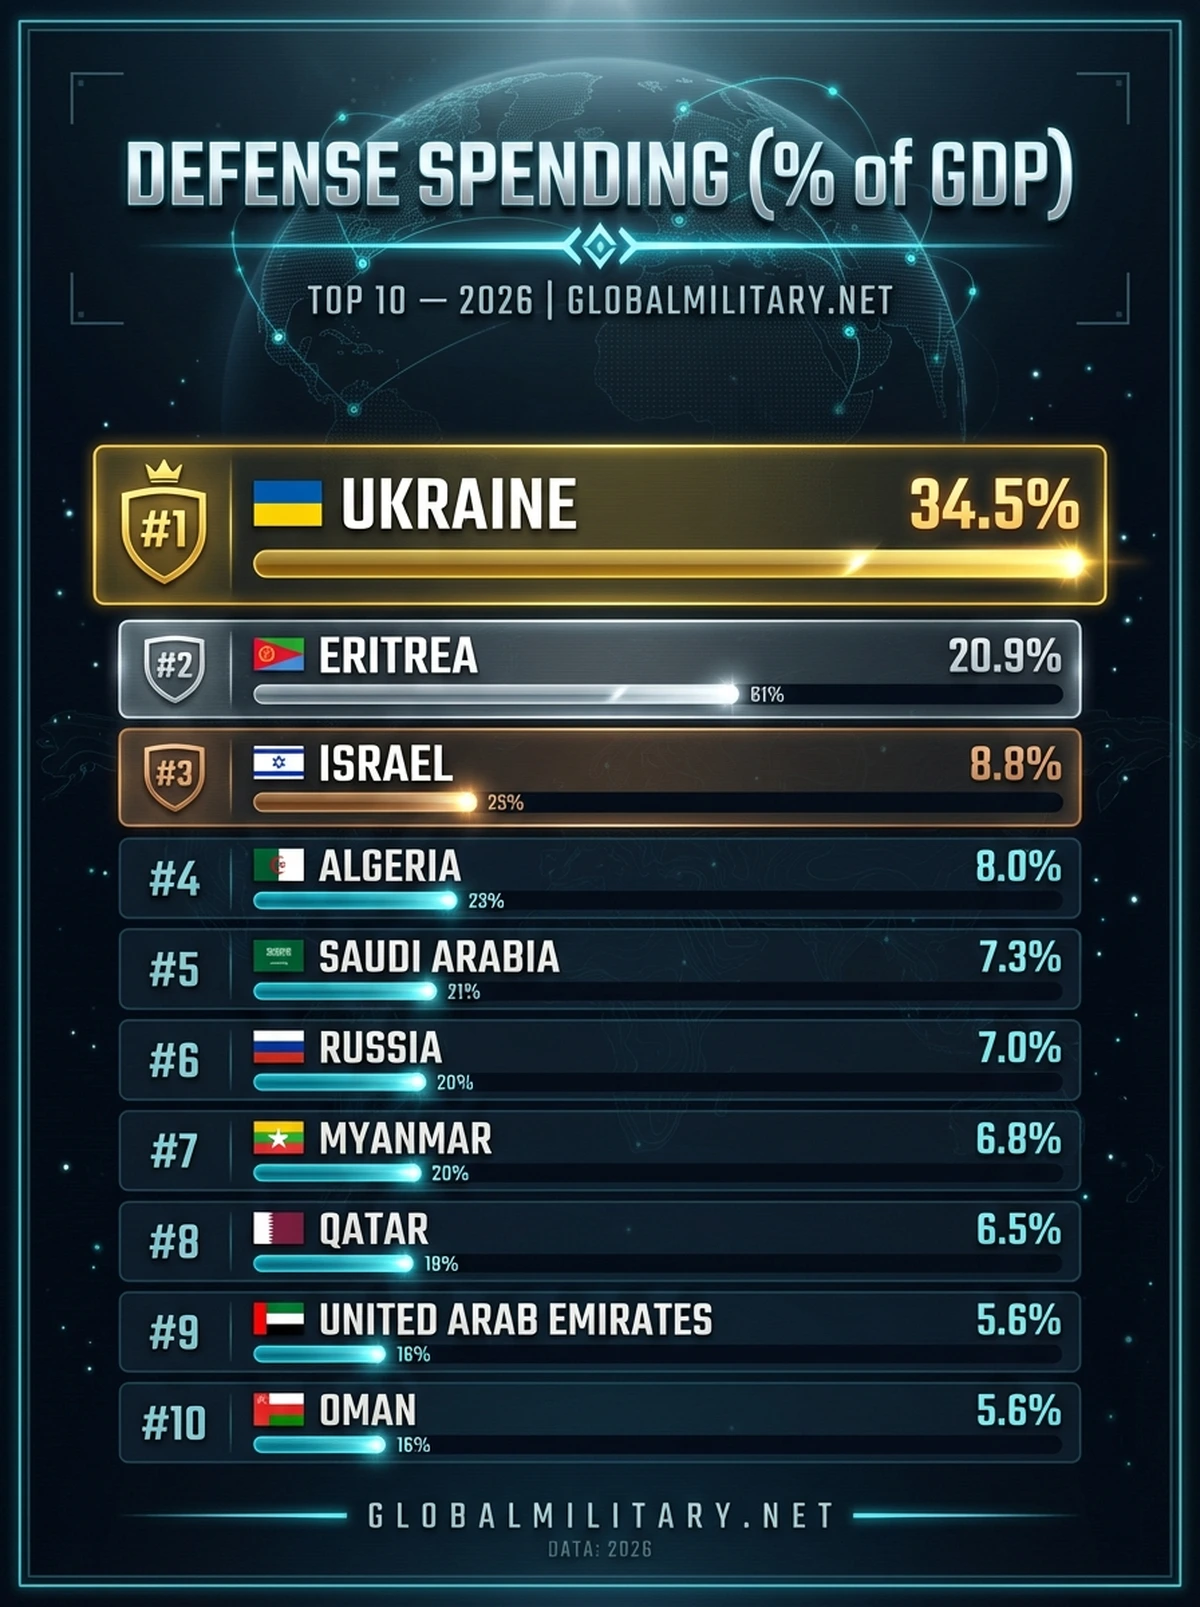
Defense spending as a percentage of GDP reveals how much of a nation’s economic output is devoted to military purposes. NATO members aim for 2% of GDP, while nations facing security threats often spend considerably more. This metric helps compare military commitment across economies of different sizes.
🇺🇦 Ukraine
Leading Country
39
Countries Ranked
Test Your Knowledge!
Play Quiz →
Think you know which countries have the strongest militaries? Test yourself!
| # | Country | % GDP | |
|---|---|---|---|
| 1 | 🇺🇦 Ukraine | 39.56% | |
| 2 | 🇷🇺 Russia | 7.00% | |
| 3 | 🇵🇱 Poland | 4.50% | |
| 4 | 🇱🇹 Lithuania | 4.00% | |
| 5 | 🇱🇻 Latvia | 3.70% | |
| 6 | 🇪🇪 Estonia | 3.40% | |
| 7 | 🇳🇴 Norway | 3.40% | |
| 8 | 🇩🇰 Denmark | 3.20% | |
| 9 | 🇬🇷 Greece | 2.90% | |
| 10 | 🇫🇮 Finland | 2.80% | |
| 11 | 🇳🇱 Netherlands | 2.50% | |
| 12 | 🇷🇸 Serbia | 2.50% | |
| 13 | 🇸🇪 Sweden | 2.50% | |
| 14 | 🇩🇪 Germany | 2.40% | |
| 15 | 🇬🇧 United Kingdom | 2.40% |
| # | Country | % GDP | |
|---|---|---|---|
| 16 | 🇷🇴 Romania | 2.30% | |
| 17 | 🇧🇬 Bulgaria | 2.10% | |
| 18 | 🇫🇷 France | 2.10% | |
| 19 | 🇭🇺 Hungary | 2.10% | |
| 20 | 🇦🇱 Albania | 2.00% | |
| 21 | 🇧🇪 Belgium | 2.00% | |
| 22 | 🇧🇾 Belarus | 2.00% | |
| 23 | 🇨🇿 Czechia | 2.00% | |
| 24 | 🇪🇸 Spain | 2.00% | |
| 25 | 🇭🇷 Croatia | 2.00% | |
| 26 | 🇮🇹 Italy | 2.00% | |
| 27 | 🇱🇺 Luxembourg | 2.00% | |
| 28 | 🇲🇰 North Macedonia | 2.00% | |
| 29 | 🇲🇪 Montenegro | 2.00% | |
| 30 | 🇵🇹 Portugal | 2.00% |
| # | Country | % GDP | |
|---|---|---|---|
| 31 | 🇸🇰 Slovakia | 2.00% | |
| 32 | 🇸🇮 Slovenia | 2.00% | |
| 33 | 🇨🇾 Cyprus | 1.70% | |
| 34 | 🇦🇹 Austria | 1.00% | |
| 35 | 🇧🇦 Bosnia and Herzegovina | 0.80% | |
| 36 | 🇨🇭 Switzerland | 0.70% | |
| 37 | 🇲🇩 Moldova | 0.60% | |
| 38 | 🇲🇹 Malta | 0.50% | |
| 39 | 🇮🇪 Ireland | 0.20% |